The efficiencies that the web provides in allowing businesses to deliver services and sell products to the world has clearly transformed the world’s economy. From insurance to groceries and everything in between most of us go to the web first in order to make or at least get a price for our purchases.
As businesses in the digital economy we are pretty good (not perfect) at building optimal routes to purchases and we are also pretty good at seeing where the abandon rates are and where people drop off. For these journeys, Google Analytics which most have tracking their visitors is a great tool. But when it comes to customer service are we anywhere near as sophisticated in measuring whether our customers are happy, are they finding what they need online, or are they simply bypassing our expensively constructed website and calling support. Can Google Analytics tell us something we can act on for Customer Service?
Tips on how to use Google Analytics to assess your customer satisfaction
First of all it is important to note that we would not recommend exclusively using GA to measure satisfaction levels. Surveys, Net Promoter Score and A/B testing are all useful and valid metrics that are extensively written about elsewhere. But given virtually every website has Google Analytics of some sort already and it is free, can you use what you currently have to deliver better insight and generate some positive actions?
Bounce Rates
Bounce Rates will vary widely depending on the type of traffic you attract to your site and how you acquire that traffic. Therefore there are no good and bad bounce rates, but what is important is that you track against what you are seeing historically.
For key support/FAQ pages a high or a growing bounce rate is a problem as it is a fairly dumb but strong indicator that whatever is on that page and how wever the visitor found it is not proving valuable. A useful thing to do is compare number of pages against each other and see if there is significant variance. A lower bounce rate page might be one to optimise against especially when tracking the journey in.
Action: Track bounce rates over time for the site overall and on specific key customer service pages. Look for significant variance over time and between pages to see if there is an issue Optimise for best performance.
Engagement Rates
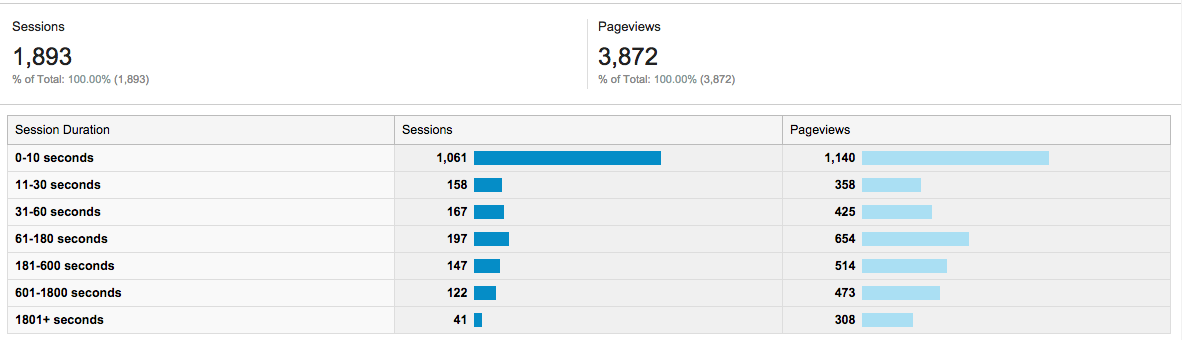
Engagement rates offer more detail on the amount of time that people are spending on various pages and and also the number of pages that visitors are viewing. Again this will depend on what goals you have set for the site in terms of why you think is right for your business. A long linger time on a page where there is a lot of relevant content is good, but for relatively simple pages with easy calls to action, a longer linger time might indicate a problem in people understanding your page.
Action: Consider the goal of a page and decide on the optimal engagement time especially where there is a success metric – i.e. do people indicate that they have found what they need on certain pages. If so how long and and can you replicate the success of that page on others?
User Flow
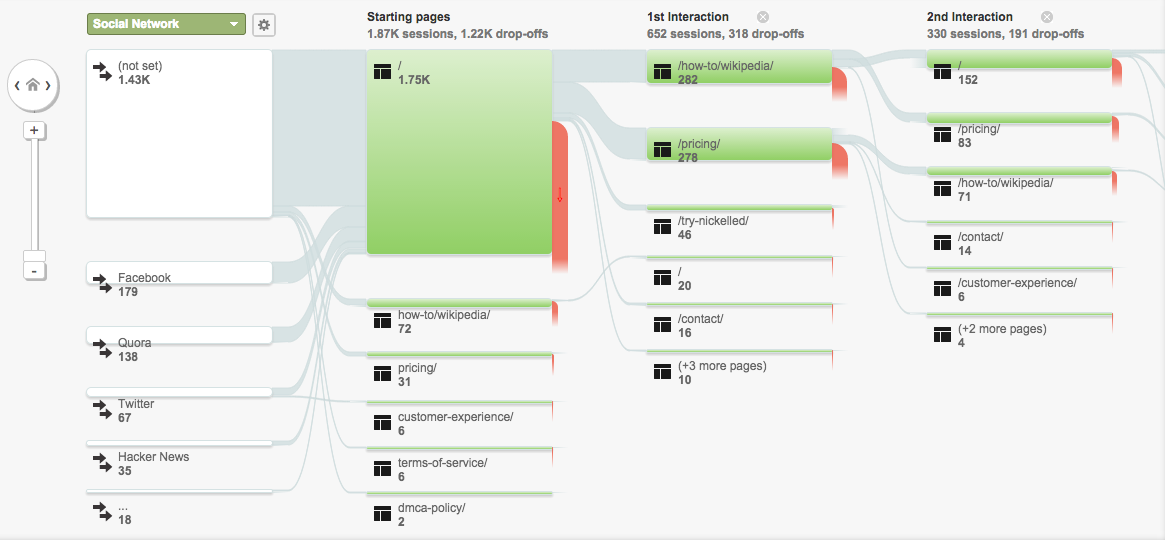
User flow can be the most valuable page depending on how well-structured your site is. For FAQ pages and support pages in general there should be defined ‘good’ flows for people to find resolution to their queries. This user flow section is a good way to discover at the outset where people typically go on your site and to start to spot patterns and problems as well as defining good outcomes.
Action: Investigate the user flows and try to add Goals to key pages so that you can track good and bad outcomes. There might be pages that instigate a larger than usual number of web chats or result in calls being made to support. These interactions may or may not be desirable for your organisation but it is essential to track how users typically get there to see if your pages are working efficiently and as designed.
Goal Setting
Goals are essential to successfully tracking satisfaction on your site. They allow you to track conversion to a certain outcome which in turn provides an endpoint to a customer journey so you can start to track where you need people to end up. We often think of goals as converting a visitor to a registrant on a site or some other new business generation goal. But actually Google itself suggests two much more appropriate Customer Satisfaction goals
Inquiry Goal: Viewed reviews and ratings Action! Encourage viewers to engage more deeply reading or submitting more reviews.
Engagement Goal: Media play, including a video, slideshow, or product demo
Action! Encourage interaction and contribution or frequent content updates to deepen user engagement.
Action: work with web team to develop sensible goals that can be added to the site. Be careful not to have too many as they can quickly become hard to manage and measure. Fewer, good goals beats many ill-defined ones. The customer journeys to goals, the drop-outs and the number of successful conclusions will be your customer satisfaction report with regard to your site. Note a goal can be negative – i.e. you can track the number of people reaching an outcome you don’t want and start to take action to correct it.
Using Interactive Guides to drive to successful outcomes
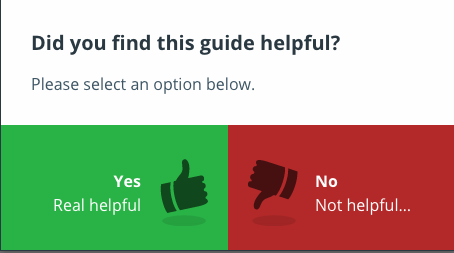
I won’t labour the point but once you start to track users going in unexpected directions on your website and dropping off altogether, the question next arises on what to do about it. We have worked with many companies on integrating our guides into the customer experience which gives you not just the benefit of pointing people in the right direction but also in allowing them to feed back whether they found what they needed – i.e. a layer of approval on top of a goal reached. We’d be happy to talk you through how to improve on what Google Analytics is telling you.