For any modern SaaS business, analytics play a critical part in the day-to-day operations of the company. With few offline operations, every decision – across strategy, sales, marketing and product – will likely be informed by the analytics data being held.
When we work with clients to help them with user onboarding, our first step is always an audit of their available data, and it’s surprising how few have put thought into how analytics can inform customer success in the first few runs of an app.
So in this post, we’ll share how we’ve set up our own systems — we’ve kept things deliberately simple, while still collecting the most important bits we need.
Who will use the data?
If you don’t yet have an answer to this question, stop and think for a second. Is customer success owned by one part of the organisation, or does it (as in our case) span across sales, marketing and product and require multiple stakeholders? If that’s the case, you’ll need to spend some time working out exactly what each team needs.
In our case, we were able to split the requirements broadly in two. First off, we needed extensive aggregated usage metrics for our product team to base decisions upon – the information didn’t need to be trackable at a user level, but it needed to paint a statistically-sound picture of users’ actions.
Secondly, our marketing and sales operations needed top-line data to help them track marketing effectiveness and move prospects through the funnel.
What we track
Knowing the requirements above made it far easier for us to plan what needed to be tracked. Essentially, we needed a solution which could log three things easily: actions, events and users.
We define an action as a user utilising a specific part of the app. Examples of actions we’re tracking include updating a profile, viewing a certain page, creating a step in one of our guides, saving a guide or updating their payment details.
An event is more user-intent driven – we think of them as material points on the way to a customer’s success with our product. So while creating a step in a guide is an action, saving the guide itself is an event – it’s a powerful signal of the customer’s ability to use our app and drive towards a successful outcome. Some examples of key actions we’re tracking include:
- User signs up
- User creates a company
- User creates their first guide
- User invites a colleague
- User’s guide gets viewed by a third-party
Finally, user tracking is self-explanatory – we need to be able to tie events to people (more on this later). To do this, we pass data such as email, name, plan and company into apps that allow it.
What we use to capture the data
Our Analytics stack is essentially built on top of two great products – Segment and Google Tag Manager. We also have a Google Analyticsintegration which I won’t go into here, because we should really have integrated it through either Segment or Google Tag Manager and are planning to at some point.
Segment, if you haven’t come across it yet, is an advanced data analytics platform which captures customer data. Its power lies in the hundreds of pre-built integrations it offers – essentially, it’s designed to capture customer data once, and then pipe it into whichever solution you choose.
Our Segment data flows into Amplitude, Drip, Hubspot, Perfect Audience, Twitter Ads and a few others besides. It also gets dumped in its raw format in a Postgres database which is dedicated solely to Segment (more on that later).
Alongside Segment, we use Google Tag Manager to fire custom javascripts which (for whatever reason, but normally because they belong to smaller companies which haven't yet built a segment integration) we don’t fire through Segment. Though Segment has been able to do 99% of what we want it to, we have the GTM container tag on the site just to make sure non-dev teams have flexibility to run javascript for the app quickly.
How we capture events
Because our application uses Angular JS with a Node.js backend, we make very few server-side calls to our analytics tracking solutions — almost everything is executed client-side as the user navigates the app.
However, because we’re sending data to a couple of different sources, we use two custom services (eventtracker.js and identifytracker.js) which run across every page template to track the key events we specify and identify the user on every page when they’re logged in.
That makes calling a specific event or action as simple as including something like:
EventTracker.page( 'guides_show', { data });
EventTracker.action( 'guides_updated', { data });
Whenever the code is executed, it gets sent straight to Segment for processing.
Visualizing the data
With the technical integration part out of the way, all we wanted to focus on was the best way to present the data being captured. The choices here are myriad, and Segment allows us to flexibility to switch between different presentation mediums as we choose.
Broadly, we have three teams accessing the data – sales/customer success, marketing and product. Each of these has a slightly different configuration based on their business needs, which I’ll cover briefly below.
Sales/Customer Success
The priority for this team is to ensure they understand how well any given customer is interacting with the app, so that they have all of the information that they need at their fingertips before speaking to or taking any next steps with a client or potential client (i.e. somebody on a trial).
The primary integration for this team is Pipedrive – we send key events into Pipedrive so that sales reps can move users through the funnel based on what they’ve done so far. For instance, we know that the next step for all trial users after signing up should be creating their first guide – so anybody who’s done that is judged as being further down the sales pipe than someone who hasn’t. And when speaking to customers, our reps know what the key outcome should be – helping the customer to create a guide.
The data also flows into Intercom, from where we deliver key in-app messages to guide users along the way.
Product Team

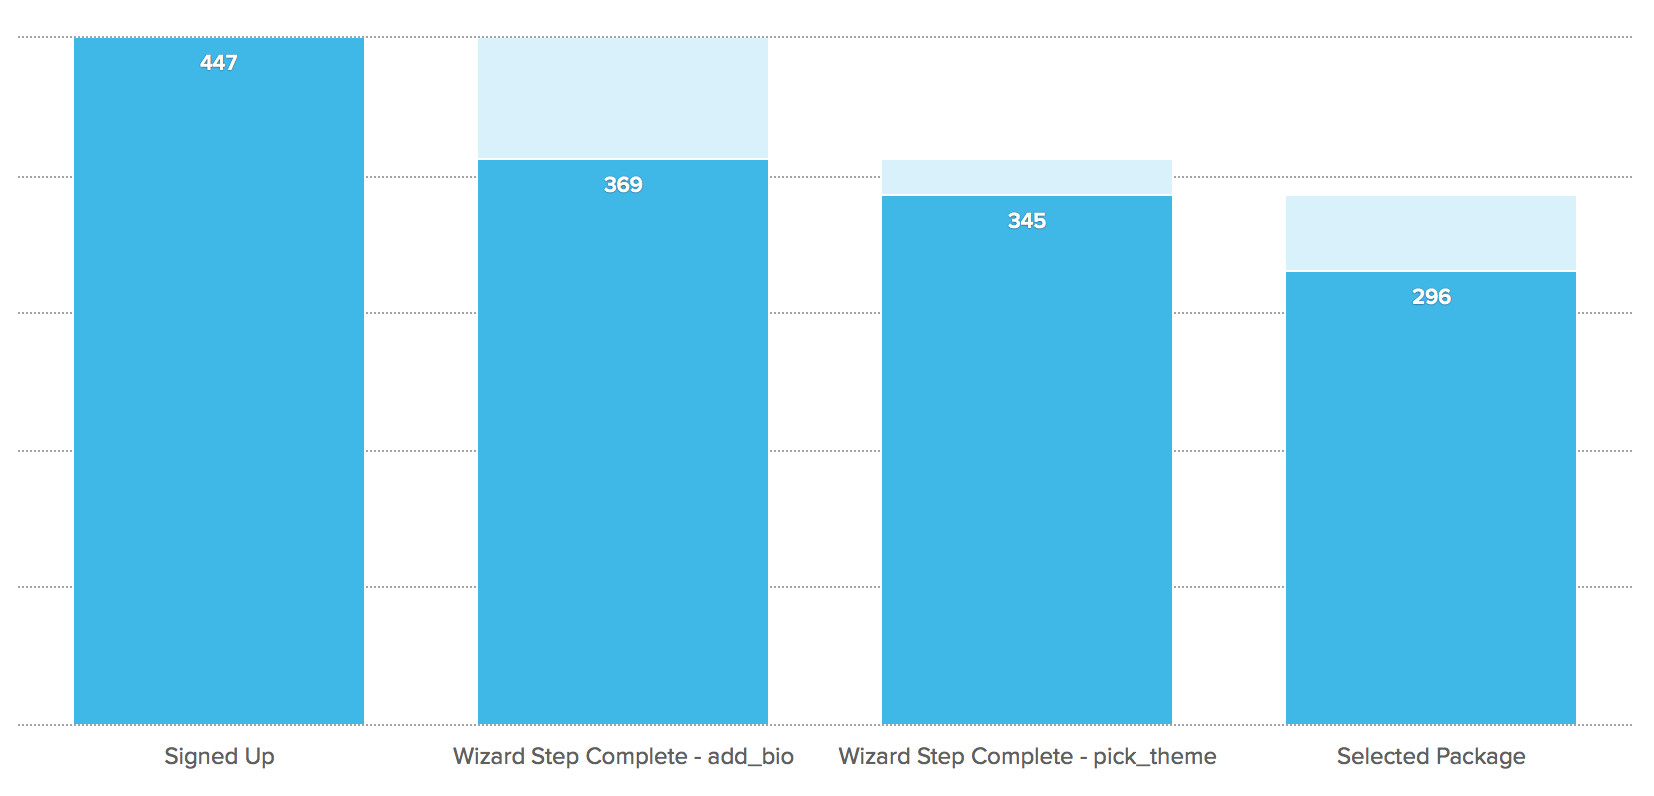
As we’ve blogged before, Amplitude is our killer app when it comes to product design – it enables us to make really clear funnels and see how users progress through them, monitoring changes over time. So surprise then, that this was our first integration – we have a bunch of company-wide dashboards allowing us to monitor the key actions and funnels we expect our users to take.
We’ve also integrated our analytics with Slack, so we get notifications when users break things or take other unexpected turns – this allows the product team to figure out what went wrong, and the customer success team to intervene.
Finally, our head of product design Fraser is a bit of an SQL whiz and will happily dive into our custom Postgres database to pull our heavy-duty product analytics where required. We have more flexibility here than we have with Amplitude – so if, for instance, we want to conduct a detailed cohort analysis using multiple factors, we can extract the data from the database using SQL and present it using a tool like Wagon.
Marketing
Finally, marketing use our analytics stack to drive budget decisions and monitor the effectiveness of individual channels. It’s not uncommon for us to discover that customer success is affected by the marketing messaging we’re using – so Google Tag Manager is linked up to Google AdWords and Google Analytics, and Segment is linked with Twitter Ads, PerfectAudience and a couple of other marketing tools.
Over to you
Hopefully, this has been a useful insight into how a SaaS company can set up a strong analytics stack for customer success. We’d love to hear your experience though – what’s worked for you in terms of ensuring you have actionable numbers with which to drive user onboarding or customer success? Let us know via @nickelledapp.
